M&D Support Dashboard
2024 - 2026A full-stack analytics dashboard that ingests data from Zendesk and surfaces actionable KPIs for a premium audio brand's support operation. Built with agentic coding — I designed the data model and UX, using AI as a development partner to ship a production tool without a traditional engineering team.
problem
Support data lived across Zendesk, Shopify, and spreadsheets with no unified view. Leadership needed KPIs. Product teams needed trend data. Weekly manual reporting took hours and delivered stale numbers.
approach
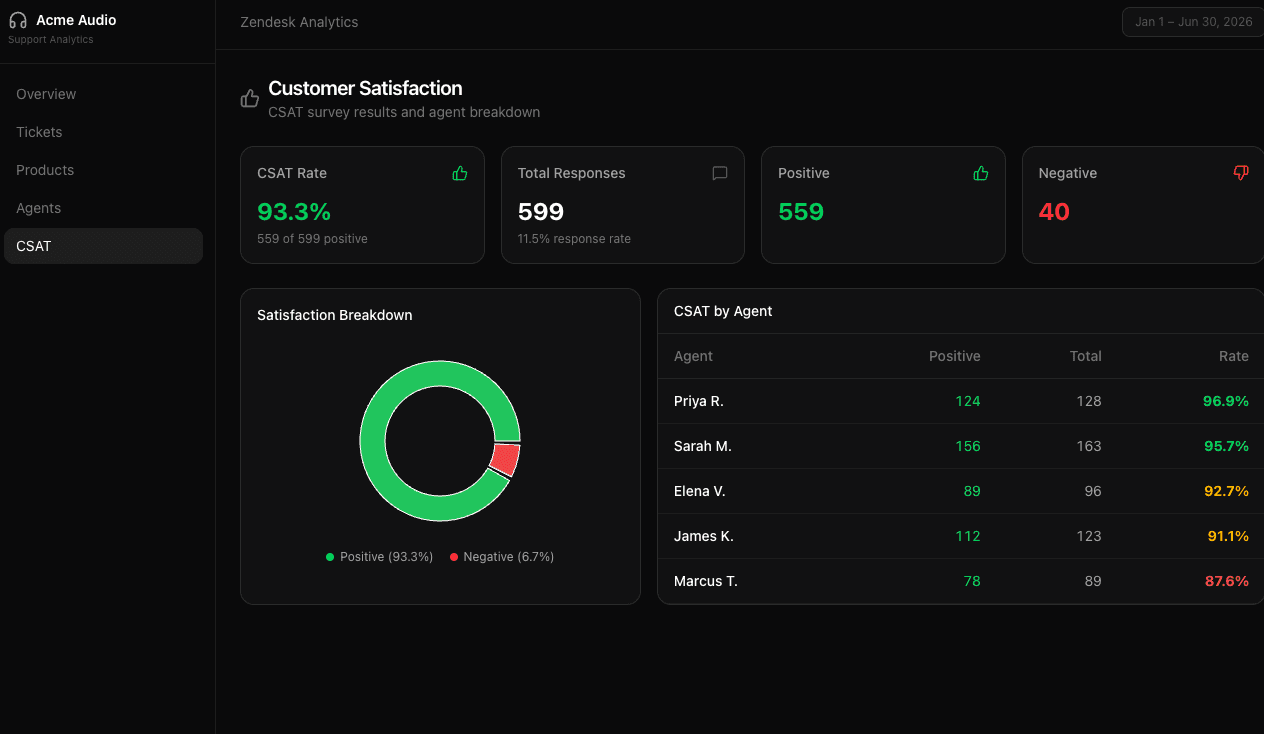
Built a Next.js full-stack app with Supabase as the database layer. Zendesk API syncs ticket data incrementally. Recharts powers the visualizations. Role-based access control ensures the right people see the right data. The entire tool was built using agentic coding — describing architecture to AI, iterating on implementations, and focusing energy on data modeling and UX.
outcome
Now used daily by leadership for quarterly reviews, product teams for prioritizing fixes, and CX operations for real-time performance monitoring. Replaced hours of weekly manual reporting with live dashboards.